
In today’s data-driven world, making sense of vast amounts of information is a challenge. That’s where data visualization dashboards come in. They provide a way to transform raw data into meaningful insights, allowing businesses to make informed decisions. But how exactly can these dashboards revolutionize your marketing insights? Let’s dive in.
The Power of Data Visualization Dashboards
Data visualization dashboards are more than just pretty charts and graphs. They are dynamic tools that allow marketers to interact with data, uncover hidden trends, and make data-driven decisions.
- Real-Time Insights: Data visualization dashboards provide real-time updates, allowing you to monitor campaigns and respond to changes quickly.
- Customization: Tailor your dashboards to show the metrics that matter most to your business.
- Collaboration: Share insights across teams to foster collaboration and alignment.
Enhancing Decision Making with Data Visualization Dashboards
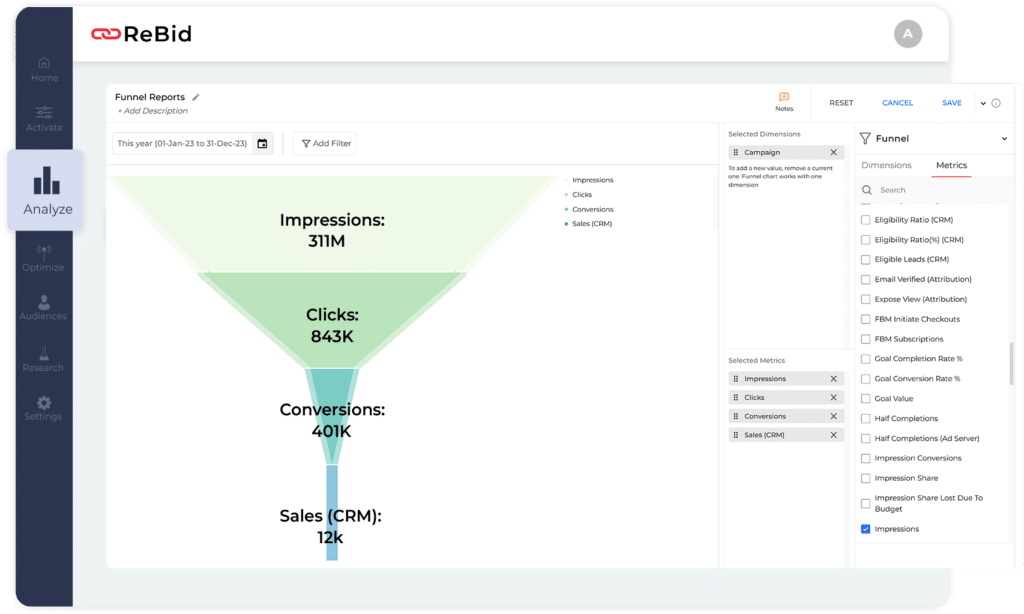
Data visualization dashboards enable marketers to see the big picture. By visualizing data, complex information becomes more accessible, leading to better decision-making.
- Identifying Trends: Spot emerging trends and patterns that might go unnoticed in raw data.
- Comparative Analysis: Compare different campaigns, channels, or time periods to understand what works best.
- Predictive Analytics: Utilize historical data to forecast future trends and make proactive decisions.
Challenges and Solutions in Implementing Data Visualization Dashboards
While data visualization dashboards offer immense benefits, they are not without challenges. Understanding these challenges and finding solutions is key to maximizing their potential.
- Data Integration: Ensuring that data from various sources is integrated seamlessly.
- Usability: Creating user-friendly dashboards that cater to different user needs.
- Security: Implementing robust security measures to protect sensitive data.
Advertiser’s CDP and Data Visualization
Advertiser’s CDP plays a vital role in the world of data visualization. By offering a unified view of customer data, it enables businesses to create personalized dashboards that reflect the unique needs and goals of the organization.
This integration of data visualization dashboards with Advertiser’s CDP can further enhance marketing insights, leading to more effective strategies and campaigns.
Conclusion
Data visualization dashboards are transforming the way marketers understand and interact with data. From real-time insights to predictive analytics, these tools offer a comprehensive view of marketing performance. By embracing data visualization dashboards, businesses can enhance decision-making, foster collaboration, and drive success.